


Over the last five years, the S&P 500 index had nine drawdown periods with downward moves of more than 5% from its 1-year high. We evaluate some characteristics of these drawdowns and show a simple strategy which would have benefited in these periods. For the future, this strategy might still be attractive for short-term market timing or as an equity rotation strategy.
V-shaped Drawdowns
Assuming that we will see more of those v-shaped drawdowns in an upward biased stock market, our first interest is to learn how dangerous these periods are.

Figure1: The chart shows the nine drawdown and recovery periods (schematically) of the S&P 500. The x axis stands for time in days, the y axis corresponds to the return in percent. The darker the blue line, the earlier the event took place in the past. Well recognizable are the last three cases (lightest blue) in which the recovery occurred faster than the drawdown took place and in which the average daily returns were very high (slope on right hand side).
We focus on the ability of the market to regain losses by reaching new highs. On average it took two months from the low of the drawdown to climb to a new high. In the worst case, during the rating downgrade of the US in 2011, five months were necessary to recover. In contrast to major equity market crisis that elevate markets to lower levels in their aftermath for a longer time frame, drawdown and recovery periods of the last five years were modest. We do not judge how much the interest rate policy of the central banks contributed to the stock market’s ability to reach new highs so quickly.
The maximum drawdown would have been -19.4% for the S&P 500 over the last five calendar years. Even if the figures are only paper losses, stock market investors are not happy to see these in their portfolios. In seven out of the nine drawdowns, the downward trend already stopped in the single digit region. All of the last five identified periods (all since 2012) are among those single digit events.
We utilize the positive effects of the recoveries for a simple timing strategy and apply it also for equity rotation with the exact same settings.
Strategy
When the S&P 500 falls more than 5% from its 1-year high and climbs backs above this -5% hurdle we receive a signal to enter the market. The holding period is one month. In case the signal is received again within that month, the holding period is extended correspondingly.
Between 2010 and the end of 2014 the strategy generated eleven signals to enter the market, resulting in an average holding period of 27 days. Investing into the S&P 500 Index only during these limited periods would have returned 43.8% (or 7.5% annually). The strategy would have been invested only a quarter of the time. The average daily return of 0.13% is remarkable. It compares well to 0.03% for the remaining days over these last five years
Obviously, we select market periods which exhibit increased probability of above average daily returns. For nine out of the eleven time frames a positive return of +4.6% on average is observed. The two periods with a negative outcome deliver -3.51% and -0.02%. Over the last three holding periods (all from 2013 onwards), the maximum drawdown was north of -1%.
Rotation instead of Market-Timing
Most investors do not wait for the next drawdown just to jump into the equity markets for a short time frame. With the simple strategy described, we do not claim to introduce a holistic market timing model as we did with our Robust Trend Model (see Trend-Following: Robustness beats Optimization). For an environment with short, mainly modest drawdowns as seen in the past few years, the insights gained from the simple strategy add value.
Investors who have to hold or want to hold equity exposure constantly, are more interested in sector or style rotation than in a short-term market timing approach. With the exact same rules for signal determination described above, we take a look at equity rotations for the identified periods. As already mentioned, we selected time frames with favorable risk properties. Why not invest into more dynamic styles, sectors or market caps for the limited time horizons? The idea is to hold rather defensive positions until the signal is received and afterwards rotate into the more offensive segments.
 >
>
Figure 2:The chart illustrates the performance of a rotation strategy that invests into the Russell 1000 Value-Defensive index until the signal determines to rotate into the Russell 1000 Growth-Dynamic index for the identified time periods. In the lower part of the figure a strong outperformance of the strategy against the S&P 500 is outlined (light green area, rhs).The dark blue area (rhs) is the roiling 250 day return of the rotation strategy.
We test a number of rotation pairs[1] with a defensive and an offensive component. Starting point is the S&P 500, representing the defensive position. The NASDAQ 100 serves as the offensive component to rotate into over the eleven time frames[2]. Even for this rough selection of the two components – easily implementable thanks to the very high liquidity of these indices – results are convincing. Since 2010, in each calendar year the rotation strategy outperformed the S&P 500. Annual return figures as well as the risk figures are close to the NASDAQ 100, although the index itself showed strong outperformance against the S&P 500 in the last five years. By being invested in the more offensive index for only 23% of the time, the rotation strategy manages to capture nearly the complete outperformance of this index
A slightly different picture evolves when looking at the Russell 2000 index. This small cap index also managed to outperform the S&P 500 over the five years but the excess return is much smaller and did not occur in each calendar year. For this scenario, the true strength of the rotation strategy is revealed. The annual return is 16.35%, easily leaving behind both indices. The Sharpe Ratio is higher and this in combination with a significantly lower maximum drawdown than a buy & hold investor in the Russell 2000 would have experienced.

Figure 3: The table compares risk and return figures of the eleven tested rotation pairs. All calculations are based on index time series without dividends to better compare results. The index mentioned first is the defensive component of the pair. A light green background illustrates that the figure of the rotation strategy is better than either the figure for the defensive or the offensive component. A dark green background demonstrates that the strategy performed better than both of its components. Red colored numbers stand for underperformance against the S&P 500. A bold font style outlines the best figure in the corresponding row.
To find stronger evidence for a superior performance of a rotation strategy from defensive to offensive positions, we make use of the style indices from Russell. A rotation implementing the Russell 1000 Defensive and the Russell 1000 Dynamic shows identical characteristics already described. The same holds for the Value and Growth equivalents. Return and Sharpe Ratio are higher for the rotation strategies than for each single index while the maximum drawdown lies somewhere between those of the defensive and offensive ones.
An observation with an even more detailed distinction uses defensive Value and offensive Growth stocks and can also be tested with the appropriate indices derived from the Russell 1000 (see figure 2). With an annual return of 20.8%, a Sharpe Ratio of 1.5 and a maximum drawdown of 14%, this style rotation pair is very attractive. Adding the large cap versus small cap topic to the scene, the Russell 2000 Growth-Dynamic can serve as the offensive component. It results in an even higher annual return. At the same time, the significantly higher volatility of the small cap index is only slightly reflected in the volatility of the rotation strategy.
Further tests were executed on the two components low beta and high beta, followed by testing the strategy with low volatility and high volatility. Results look as promising as already seen with the other components. Finally, a rotation with single sectors once more validated our findings.
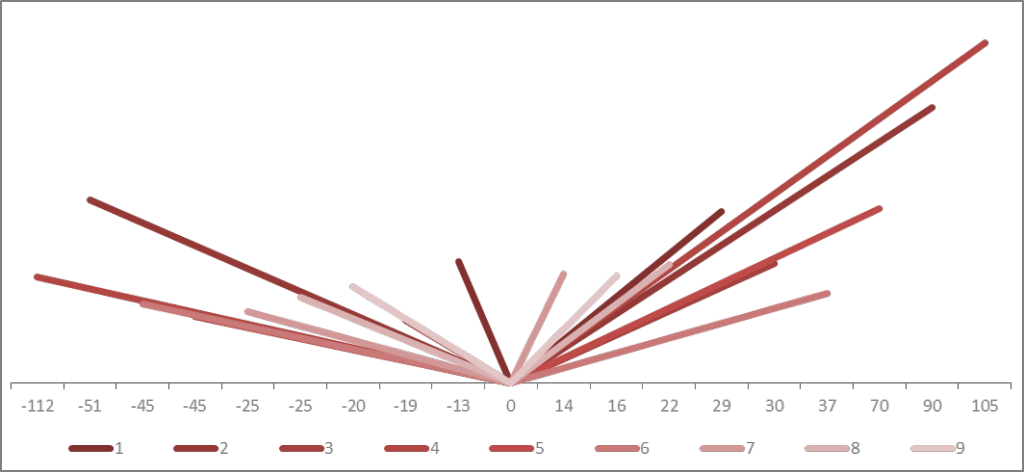
Figure 4: The chart shows the drawdowns and recoveries (schematically) of a rotation strategy that utilizes the Russell 1000 Value-Defensive index and the Russell 1000 Growth-Dynamic index. The time frames are the drawdown and recovery periods of the S&P 500 demonstrated in figure 1. Obviously, there is less symmetry between the left and the right hand side of the chart compared to figure 1. Without looking at risk and return figures, one can find the smaller drawdown movements (left) in relation to the stronger upward movements (right).
Conclusion
The drawdown and recovery periods of the S&P 500 in the last five years reveal valuable characteristics. The insights gained can be applied for market timing or for an equity rotation strategy. The described strategy is very simple, implementing rudimentary selected parameters. Sometimes, it is rewarding to build strategies not for implementation but to learn about market characteristics and to see a change in the market environment early.
Significantly better return and risk figures of the rotation strategy compared to the index are mainly driven by identifying the correct time frames to rotate from a defensive into an offensive equity allocation. A rough definition of which equity index to classify as defensive or offensive is sufficient for significant risk-adjusted outperformance of the rotation strategy. The insights gained might be valuable for the next drawdown in an upward biased stock market.
_______________
[1] Some of the indices mentioned in this paper are price indices, others are total return indices. All risk and return figures are calculated based on the index time series.
[2] To categorize the S&P 500 as more defensive than the NASDAQ 100 is open for discussion. A categorization depending on the current weighting of the components in the indices should be more appropriate to differentiate between defensive and offensive indices.